
Stop using the default Excel charts
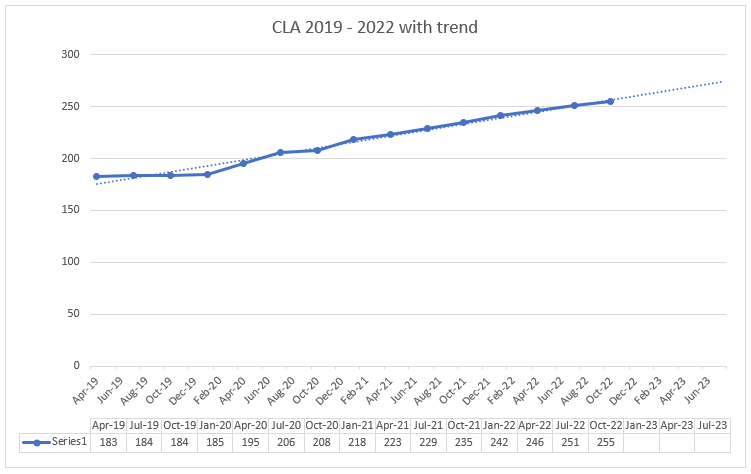
I was sent the chart above by a colleague looking to demonstrate how to "not" draw an effective chart. It came straight from a local education authority web page.
Overall, I guess this chart is not critically bad. You can actually understand it. But it suffers from "default chart syndrome", as the creators of the graphic have forgotten (or don't know) how to make things better.
Why its bad
- Data points connected with a line AND a best fit line
- The x-axis labels doesn't correspond to the data in the data table
- Data table labelled "Series 1"
- The y-axis starts at 0
- Title is "jargon" - I know what CLA stands for, but it is unclear if the intended audience would.
For me, this is just sloppy.
5 minutes of Excel-fu generated this:
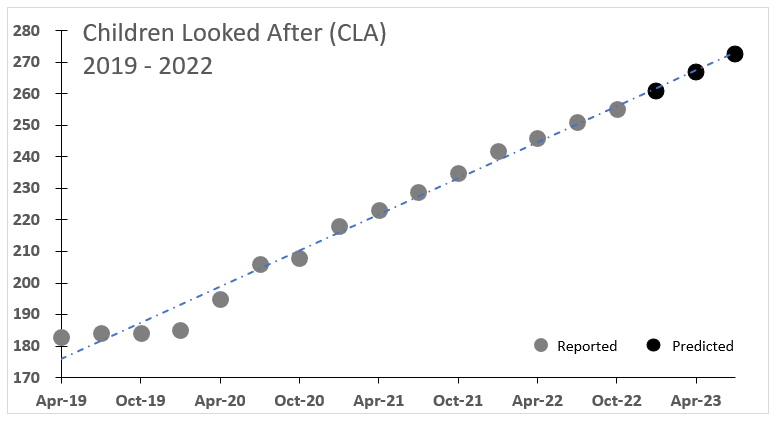
Why this is better
- The data is clear, not connected
- The best fit line draws attention to the linearity of the data without obscuring it
- y-axis scaled to fit the data
- x-axis reduced to 6monthly labels, which aligns with the chart above
- Data table removed
- Horizontal gridlines removed
- Fonts enlarged
- 3 predicted values are highlighted in a different colour and labelled as "predicted"
- CLA replaced with "Children Looked After"
Call to action:
Are you satisfied with the default Excel charts? Consider who is going to be viewing the chart an whether or not it is as clear as you think it is. Remember, you know the data, so the chart is for an audience that does not.